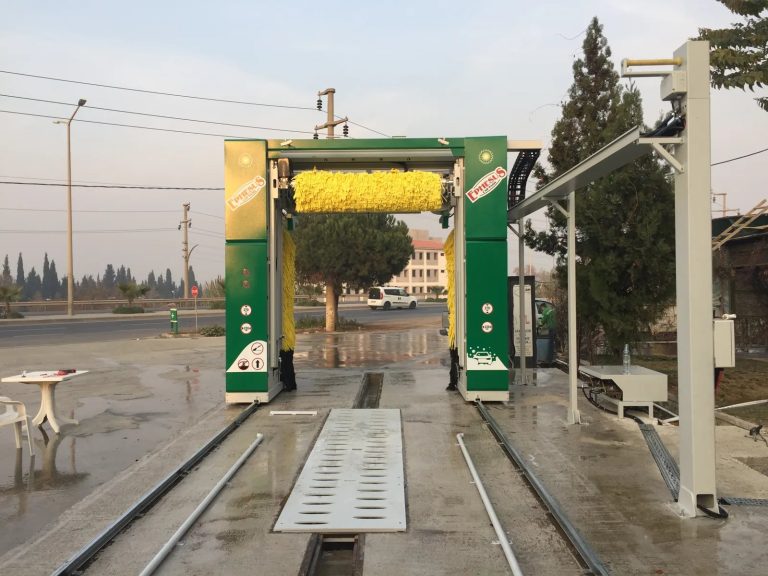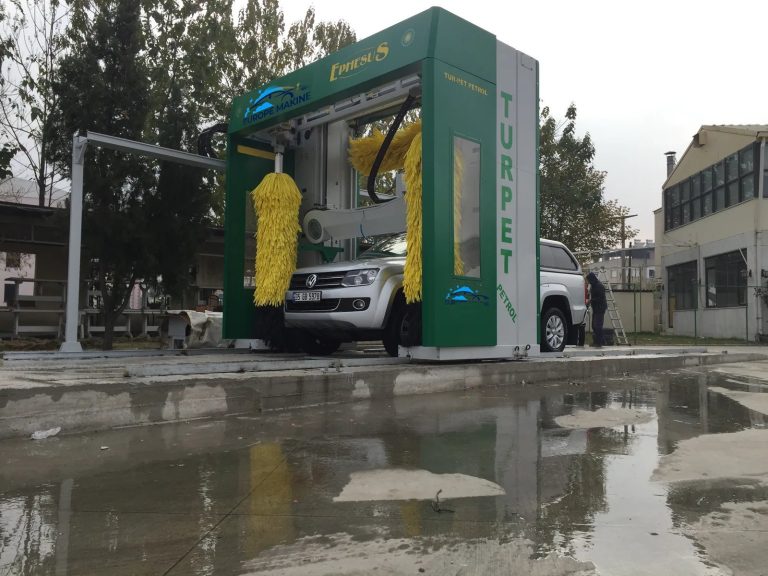
A car wash traffic impact study is a report, usually prepared by a traffic engineer, that estimates how many vehicles your tunnel will add to the road, when they will arrive, and whether the queue for the wash will stay on your property. The planning authority uses it to decide whether the driveway, the stacking lane and the nearby intersection can cope. The stacking lane length it recommends is not a fixed national figure. It comes from the site, the machine and the local jurisdiction.
This article explains what such a study normally contains, how a tunnel’s throughput feeds the queue analysis, why the driveway matters as much as the lane, and what you can prepare before the engineer starts. It does not give a stacking length, because no verified national rule exists, and it does not tell you whether your town requires a study. Both are set locally.
What a traffic study is actually trying to prove
A planning board is not asking whether a car wash is a good business. It is asking a narrower question: will this use create a hazard or a nuisance on the public road? For a tunnel wash the usual worry is easy to picture. Cars arrive faster than the tunnel can process them, the line grows past the entrance, and vehicles wait on the street or block the neighbouring road.
A study answers that worry with evidence. It estimates demand, tests the road and the driveway against it, and shows where the queue ends. If the answer is uncomfortable, the study also shows what would fix it: a longer lane, a different entrance position, a turning lane or a change in how the site circulates.
It helps to treat the study as a design tool rather than a hurdle. A site that looks marginal on paper can often be made to work by moving the pay point, reshaping the entrance or changing the lane layout. Finding that out before you submit is much cheaper than finding it out at a hearing.
The standard sequence of a traffic impact analysis
There is no single national template for car washes, but the method behind a traffic impact analysis is well established. The Federal Highway Administration hosts a worked example, Incorporating Data-Driven Safety Analysis in Traffic Impact Analyses, that follows a small commercial site with a drive-through. Its sequence is a useful outline of what an engineer does:
- Forecast the trips the site will generate, using the Institute of Transportation Engineers (ITE) Trip Generation report.
- Report the expected trips in the morning and afternoon peak hours.
- Check the level of service of the affected signalised intersection in both peak hours.
- Run a 95th-percentile queuing analysis on the affected lanes.
A note on scope: that example is a drive-through pharmacy, not a car wash. It is useful only to show the method. Its figures do not apply to a tunnel wash, and nothing in it should be read as a car wash trip rate or a stacking requirement.
The same example also records that the site is reached from one leg of an existing traffic signal and sits across from a residential area. That is a reminder that a study is not only about the number of cars. Where the driveway meets the road, and who lives opposite, are part of the picture.
Trip generation: where the numbers come from
Trip generation is the estimate of how many vehicle trips your site will add. In the FHWA example it comes from the ITE report. For a car wash, the engineer chooses the basis for the estimate and the jurisdiction has to accept it. I could not verify a published trip rate or land-use code for automated car washes in the sources reviewed for this article, so you should not expect to find a reliable figure online and plug it in yourself. Ask your engineer which basis they propose and why.
Two practical points are worth raising early:
- Entering and exiting trips are counted separately. A single customer makes an arrival and a departure, and the study treats the two movements at the driveway differently.
- Not every trip is new. Some customers will already be driving past on that road. Whether the study credits this, and how, is a judgement the local authority may accept or reject. Agree the approach before the work is done, not after.
Because the choice of method is contestable, many engineers agree the scope of the study with the jurisdiction at the start. That scope usually fixes which intersections are examined, which time periods are tested and what trip basis will be used. It is a sensible first conversation.
Peak-hour counts: two different peaks
The FHWA example reports trips for the morning and afternoon peak hours. These are the busiest hours of the adjacent road, and the study tests whether your added traffic worsens the level of service at the nearby intersection in those hours.
A car wash adds a second consideration, because its own busiest period may not coincide with the road’s. A wash can be quiet when commuter traffic peaks and busy at another time of day or week. A study that tests only the road’s standard peaks may miss the period when your queue is longest. I found no sourced figure for how car wash demand is distributed across the day, so this is something to discuss with the engineer and the jurisdiction rather than assume. Ask which periods they intend to test, and whether the authority expects any additional period beyond the usual two.
Existing road counts matter as well. The study needs a baseline of what the road already carries before it adds your trips. If the count is old or taken in an unusual week, the whole analysis is weaker. Check the date and conditions of any count that is reused.
Level of service in plain terms
Level of service is a grading of how well an intersection moves traffic, reported for the peak hours. The study compares the intersection with and without your site. The question the board cares about is whether your trips make the grade worse, and by how much.
You do not need to run the analysis yourself, but you should understand what it is for. If the nearby signalised intersection is already close to its limit, even a modest number of added turning movements can be flagged. In that case the discussion shifts from the lane on your property to what you might do at the intersection or the driveway, and the cost implications become a real part of site selection.
Stacking lane length: how the answer is built
Stacking lane length is the length of queue space you provide on site before the wash entrance. It is the figure most owners ask about first, and the one with the least reliable shortcut. I found no approved national source giving a stacking length, or a number of stacking spaces for a tunnel wash, so this article does not give one. If you see a rule of thumb quoted online, treat it as a starting question for your engineer and check it against your jurisdiction’s code.
What can be described is how the number is built. It rests on three things.
1. How fast the tunnel can process vehicles
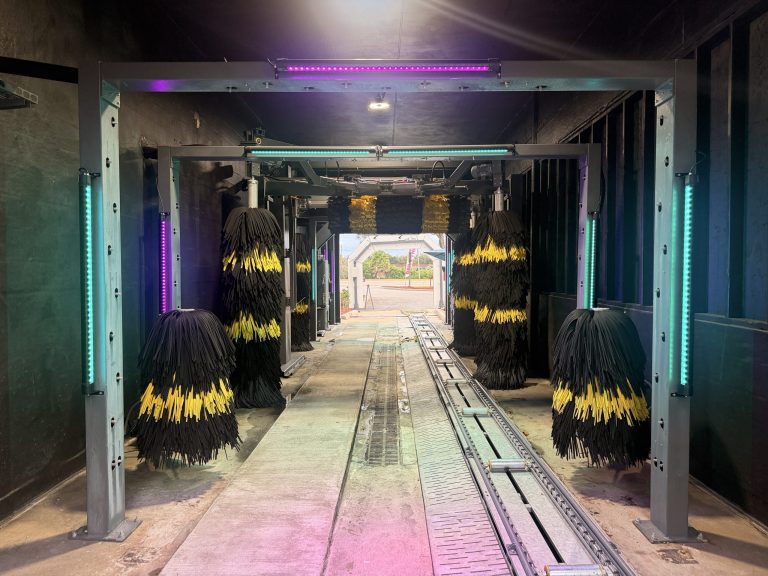
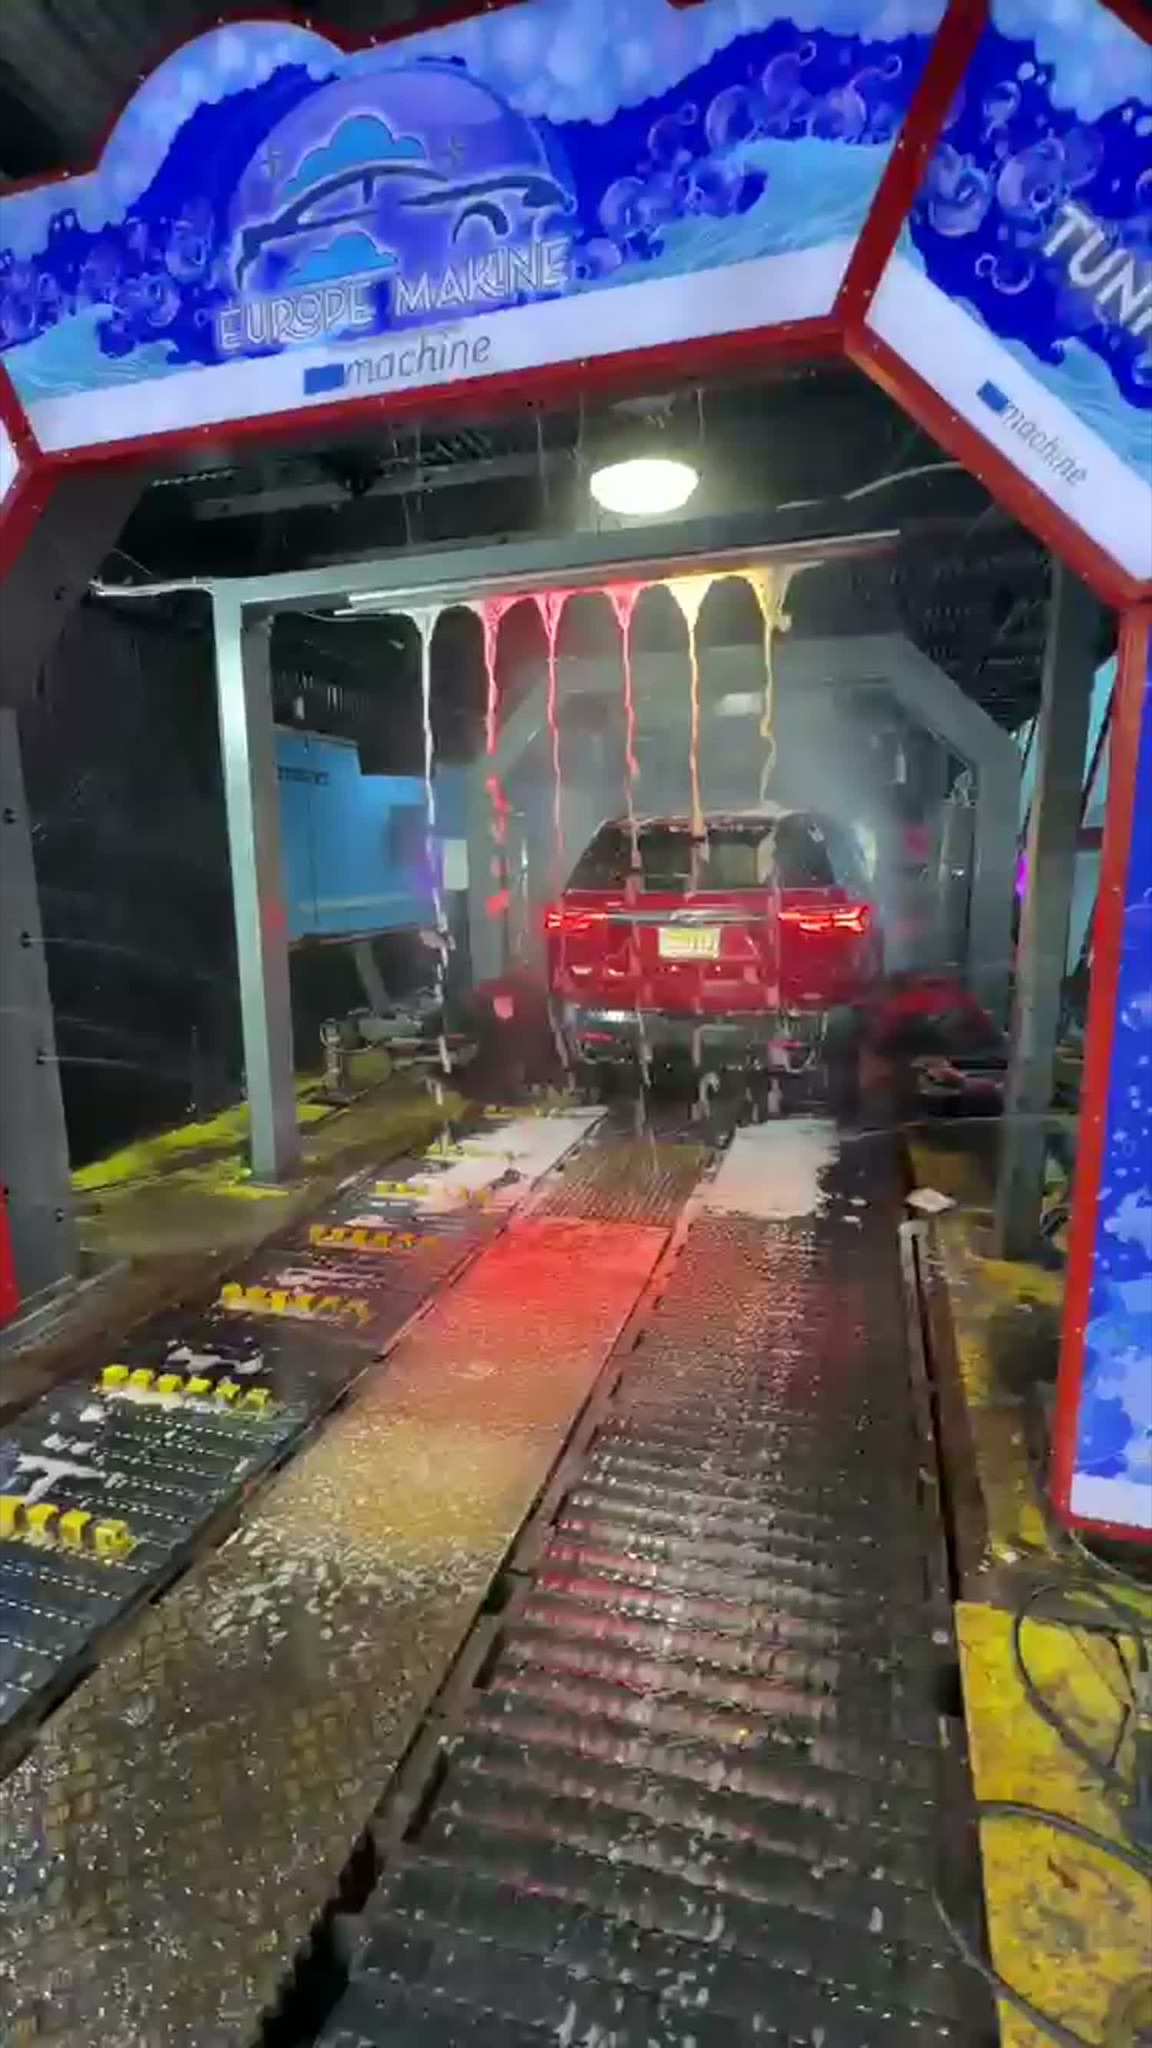
This is the service rate. The tunnel is the bottleneck, so its throughput sets how quickly a queue can clear. For Europe Makine’s conveyor tunnel system, the published figure is that it washes and dries 30 to 60 vehicles per hour. That is a manufacturer-published throughput, not a measure of demand. It tells the engineer how fast the queue can drain, not how fast it will fill. The actual rate on your site depends on the configuration, the wash package chosen and how customers are loaded onto the conveyor.
2. How fast vehicles arrive
This is the arrival rate, and it comes from the trip generation and peak-hour work above. It is the least certain input. When arrivals run below the service rate the queue stays short and clears. When arrivals run above it, even for a limited period, the queue builds and keeps building until the surge ends.
3. How much risk the jurisdiction will accept
The FHWA example uses a 95th-percentile queue. In plain terms, that is a queue length that would be exceeded only a small part of the time. Designing the lane to a 95th-percentile queue accepts that, on rare occasions, the queue will be longer than the lane. Whether the jurisdiction accepts that level of risk, and what happens when the queue does overflow, is a local decision. Some authorities may want a more cautious design. Ask which percentile they expect before the analysis is finalised.
Once the engineer has a queue in vehicles, it is converted to a length using an assumed space per vehicle. That assumption can also differ between jurisdictions, and it should be stated in the report so the board can see how the length was reached.
Throughput is a ceiling, not a promise
It is tempting to take the high end of a published throughput range and use it in the model, because it makes the queue look shorter. Resist that. The 30 to 60 vehicles per hour for a conveyor tunnel is a range for a reason. A study built on the top of the range invites a reviewer to question it, and if the real operation runs slower the queue will be longer than the design allows.
A more defensible approach is to agree with the engineer which throughput figure the study will use, document where it came from, and test the lower end as well. If the lane still works at the slower rate, the design has margin. If it only works at the optimistic rate, you have learned something important before you have committed to the site.
Other published figures from the same manufacturer show how much the answer depends on machine type. The Cirrus 5N averages 24 to 32 vehicles per hour wash-only, and about 14 with drying. The Acrobat 2X washes 3 to 5 vehicles per minute of operation time. These are different formats serving different sites, and they are not interchangeable inputs. The point for the traffic study is simply that the machine you choose changes the service rate, and therefore the queue. Settle the equipment before the study is finalised, not afterwards.
Access design: the driveway matters as much as the lane
A stacking lane can be long enough on paper and still fail if the driveway is badly placed. The Federal Highway Administration defines access management as the proactive management of vehicle access points to land next to roadways, with the aim of safe and efficient use of the transportation network. It lists the areas this covers: driveway spacing, traffic signal spacing, median treatments and openings, turning and auxiliary lanes, and street connections.
Two ideas from that page apply directly to a wash. First, fewer driveways spaced further apart allow more orderly merging. Second, jurisdictions are expected to balance property access against the functional integrity of the road. Your wish for a convenient entrance is weighed against the road’s job of moving traffic.
FHWA’s access management trifold lists the main techniques: access spacing, turning lanes including dedicated left-turn and right-turn lanes, median treatments, and the location, spacing and design of driveways. When a study recommends a turning lane or a restricted movement at your entrance, it is drawing on this family of tools.
The driveway throat and the nearby intersection
The reasoning here is ours, not an FHWA statement about car washes. If the queue backs up from the wash entrance past the end of the stacking lane, it reaches the driveway. A queue in the driveway can block cars entering and leaving, and a queue beyond it spills onto the public road. That is why a study examines the driveway throat, the stretch just inside the entrance where vehicles turn off the road and begin to line up.
FHWA’s technical summary, Access Management in the Vicinity of Intersections, covers queues at signalised intersections and where a driveway sits relative to them. It also addresses driveway width and the throat. A driveway close to a signal can be hit by the intersection’s own queue, which can leave no room for entering vehicles to clear the road. That is one reason the position of your entrance on the frontage can matter more than the area of the site.
Site layout choices that change the traffic result
Several decisions inside the boundary affect what the study finds. None of them carries a sourced number here, but each is worth raising with your designer and engineer.
- Where the queue sits. A lane that runs parallel to the frontage keeps cars off the road side. A lane that points at the entrance puts the queue toward the driveway.
- Where customers pay or choose a package. Any step that makes a vehicle stop is part of the service time. If the decision point is early in the lane, delay happens upstream of the tunnel and the whole queue slows. A pay point that is slow or confusing can lengthen the queue even when the tunnel itself runs well.
- Exit routing. Vehicles leaving the tunnel and the drying area should have a clear path to the road that does not cross the incoming queue.
- Vacuum or finishing areas. If customers linger after the wash, they take up circulation space and can slow exit flow. Show them in the layout so the study accounts for them.
- Escape routes. Some jurisdictions look for a way for a driver to leave the line without going through the tunnel. Whether yours does is a local question.
Present these as design choices, not details to add later. Changing the layout after a study has been accepted often means going back to the board.
The neighbours are part of the study
The FHWA example notes that its site sits across from a residential area. Neighbouring uses affect which movements are acceptable. A driveway opposite homes may be restricted to certain turns, and queue spill that blocks a residential street is likely to draw objections.
A traffic study does not deal with noise or water, which are separate permit topics. But the same hearing may hear all of them together, and a clear traffic result helps. If your study shows the queue staying on site, you have an answer ready when a neighbour raises it.
What to prepare before the engineer starts
You can save time and cost by arriving with the following:
- The proposed machine type and the manufacturer’s published throughput, with a note that it is a published figure and not a demand rate.
- Your intended hours of operation.
- A draft site plan showing the entrance, the lane, the pay point, the tunnel entry, the exit and any vacuum area.
- The jurisdiction’s code section on stacking or drive-through queues, if one exists, and the name of the officer who handles it.
- Any existing traffic counts for the road, with their dates.
- A short list of the neighbouring uses and any known objections.
Then ask the engineer to confirm in writing what the study will test: the intersections, the time periods, the trip basis and the queue percentile. A short scope agreed with the authority is better than a long report that answers the wrong question.
What is decided locally, and what you should not assume
Several points that owners often ask about cannot be settled from general sources:
- Whether your town requires a study at all. I found no approved source for a national rule or a threshold, such as a trips-per-hour trigger. These vary by state and municipality. Ask the planning department.
- The stacking requirement. The local jurisdiction and its traffic engineer set it, and it may be written into code or negotiated in review.
- The edition of the ITE report in use. The FHWA example cites an earlier edition, and I did not verify which edition applies now. Your engineer will know what the jurisdiction accepts.
If a number is quoted to you as a standard, ask for the code section or the engineer’s report behind it.
Using the study at the hearing
A clear traffic result is one of the more concrete things you can bring to a public meeting. Present it plainly: where the queue ends, how the driveway works, and what you have done about the neighbours. Keep to what the study shows and avoid promises it does not support.
Some owners also mention community benefit. The International Carwash Association’s guide, Meeting with Local Policymakers, is aimed at people proposing a new car wash. It says a new professional car wash creates between 5 and 20 local jobs, along with water and sewer revenue and property tax revenue. The portion reviewed does not address traffic or stacking, so use it for the benefits discussion and rely on your engineer’s report for the traffic one.
Where Europe Makine fits
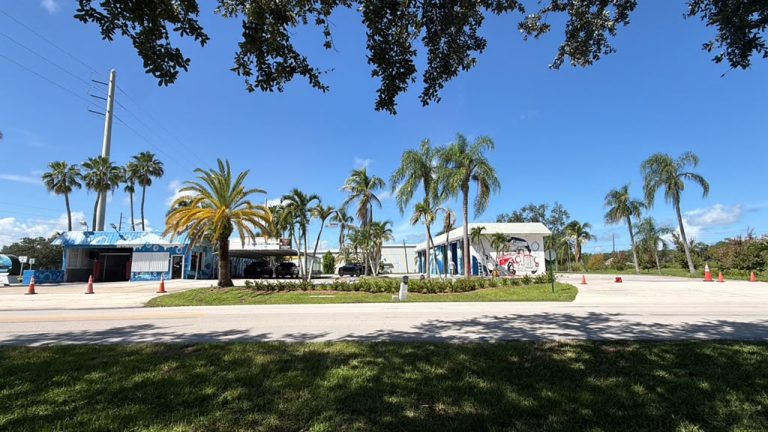
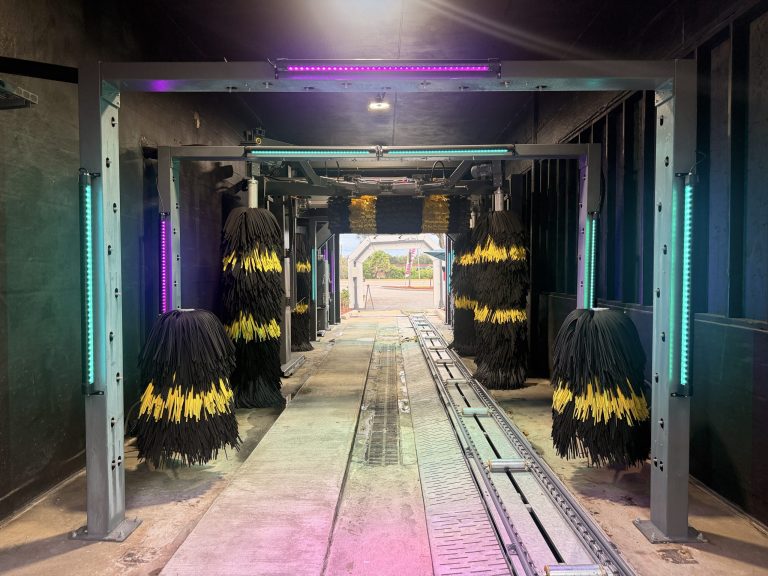
Europe Makine manufactures five wash systems, including a conveyor tunnel system, and builds turnkey car washes. In that process it secures the site, clears permits, installs and calibrates the machines, hires and trains the crew and hands over a running operation. Permit-stage work such as a traffic study sits within that scope, which is why the machine’s published throughput is one of the first inputs the engineer asks for. Ali’s Car Wash in Ocala, Florida runs on Europe Makine machines, was built through the turnkey process and is open to the public.
Whoever builds the wash, the principle holds: choose the machine, settle the layout, and let a qualified traffic engineer test the site against what your jurisdiction expects before you commit to it.